flowchart TD
  A[Would I Ever Sell a Stock for Moral Reasons?] -- "Yes" --> B[Valid]
  A -- "No" --> C[Valid]
  A -- "Accurate" --> D[Valid+]
Divestments Don’t Destroy Returns
Divestment
Draft
There are countless ways to destroy the value of your investment portfolio.
Divesting is not one of them.
I’ve overseen (and timestamped) each of the thousands of exclusion decisions Ethical Capital has made over the course of our four year history.
And to avoid testing anything other than the effect of our exclusion process, I’ve defined a matrix
Warren Buffett went so far as to call it a prerequisite for intelligent investing in 1996:
“Intelligent investing is not complex, though that is far from saying that it is easy. What an investor needs is the ability to correctly evaluate selected businesses. Note that word”selected”: You don’t have to be an expert on every company, or even many. You only have to be able to evaluate companies within your circle of competence. The size of that circle is not very important; knowing its boundaries, however, is vital.” - Warren Buffett,(Berkshire Hathaway)[https://www.berkshirehathaway.com/letters/1996.html]
To be clear, Buffett was only saying that we ignore input from our intuitive preferences into our investment decisons at our peril.
> You must also resist the temptation to stray from your guidelines: If you aren't willing to own a stock for ten years, don't even think about owning it for ten minutes." @buffett1996Strong vs weak form
I spend a lot of time at the beginning of relationships assessing this compnonent of a client’s character. a willingness and abiltity to stomach uncertainty are
But that’s clearly not the only unsettling thing that’s possible… or happening.
Attempts to measuure the true costs of divstment have historically been stymied by the lack of accurate-point in tim
(^)I define divesting as removing seciruities from a portfolio (or the possibility of entering a portfolio) based on moral/ethical criteria captured by our screening policy. ##
d3 chart
chart = {
// Prepare the series: const dates = Array.from(d3.group(traffic, d => +d.date).keys()).sort(d3.ascending); const series = d3.groups(traffic, d => d.name).map(([name, values]) => { const value = new Map(values.map(d => [+d.date, d.value])); return {name, values: dates.map(d => value.get(d))}; });
// Specify the chart’s dimensions. const overlap = 8; const width = 928; const height = series.length * 17; const marginTop = 40; const marginRight = 20; const marginBottom = 30; const marginLeft = 120;
// Create the scales. const x = d3.scaleTime() .domain(d3.extent(dates)) .range([marginLeft, width - marginRight]);
const y = d3.scalePoint() .domain(series.map(d => d.name)) .range([marginTop, height - marginBottom]);
const z = d3.scaleLinear() .domain([0, d3.max(series, d => d3.max(d.values))]).nice() .range([0, -overlap * y.step()]);
// Create the area generator and its top-line generator. const area = d3.area() .curve(d3.curveBasis) .defined(d => !isNaN(d)) .x((d, i) => x(dates[i])) .y0(0) .y1(d => z(d));
const line = area.lineY1();
// Create the SVG container. const svg = d3.create(“svg”) .attr(“width”, width) .attr(“height”, height) .attr(“viewBox”, [0, 0, width, height]) .attr(“style”, “max-width: 100%; height: auto;”);
// Append the axes. svg.append(“g”) .attr(“transform”, translate(0,${height - marginBottom})) .call(d3.axisBottom(x) .ticks(width / 80) .tickSizeOuter(0));
svg.append(“g”) .attr(“transform”, translate(${marginLeft},0)) .call(d3.axisLeft(y).tickSize(0).tickPadding(4)) .call(g => g.select(“.domain”).remove());
// Append a layer for each series. const group = svg.append(“g”) .selectAll(“g”) .data(series) .join(“g”) .attr(“transform”, d => translate(0,${y(d.name) + 1}));
group.append(“path”) .attr(“fill”, “#ddd”) .attr(“d”, d => area(d.values));
group.append(“path”) .attr(“fill”, “none”) .attr(“stroke”, “black”) .attr(“d”, d => line(d.values));
return svg.node(); }
JLens/ADL release claims divestment would cost US endowments $33.2 billion (JLens Investor Network and Anti-Defamation League 2024) over ten years. Our response:
- Do the math. Rebuild the JLens setup, run point-in-time exclusions, post the performance + factor stats.
- Coordinate the actors. List where institutions, individuals, and asset managers hold the controls.
- Act III – Introduce Dryvest. Show the tooling that keeps future fights on the data.
Act I – Doing the Math on Divestment
Reconstructing the JLens Methodology
- 2024 exclusion list back-filled to 2014 despite core sources (OHCHR 2020, DBO 2021) not existing at the time.
- 38 names (~32% of index weight) removed with “no other adjustments”; cash drag + sector drift create 1.64 pp annual tracking error = 91% of the claimed loss (JLens Investor Network and Anti-Defamation League 2024).
- Data vendors, rebalance cadence, and constraints not disclosed; headline cannot be replicated or audited.
Data and Methods for the Replication
Point-in-time rebuild checklist (ports 25–500):
- Repo + host:
rawls:/home/srvo/backtest, uv envvectorbtpro, exports fixed viaPYTHONPATH=/home/srvo/dev/exclusions-manager:/home/srvo/backtest,BACKTEST_WORKERS=1. - Batch runner:
scripts/run_strategy_batch.pysequentially per size forbaselineandcomprehensive, appending tobatch_pit_*CSV/log pairs. - NAV: use
portfolio.asset_value + portfolio.cash; refreshedscripts/factor_attribution.py(nownumpy.linalg.lstsq) writeslogs/factor_attribution.csv. - QA: diff outputs against
logs/pre_rerun_20250929/snapshot before releasing summaries. - Published extracts (
scripts/generate_condensed_reports.py):backtest_summary.csv,backtest_deltas.csv,backtest_deltas_by_size.csvinassets/data/backtest/; charts inassets/blog-images/backtest/regenerate from the same script.
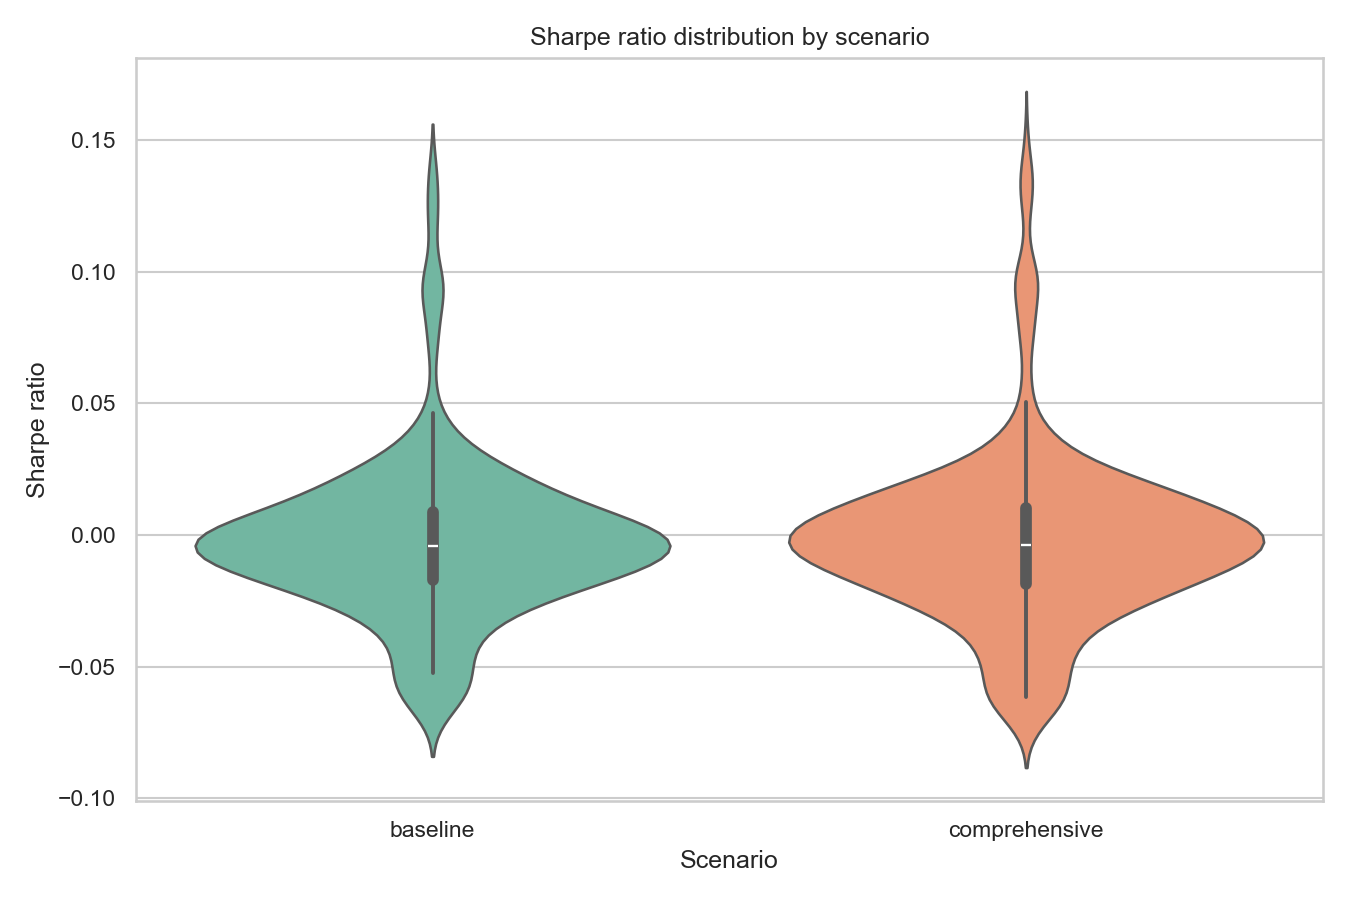
Results from the Point-in-Time Reruns
- Baseline vs comprehensive deltas collapse once cash gets redeployed; numbers below show basis-point moves.
- Size 25 is the noisy sleeve (~5 bps annual delta). Sizes 150–500 sit basically on zero.
NA= jobs still running (mostly comprehensive + heavier exclusions).
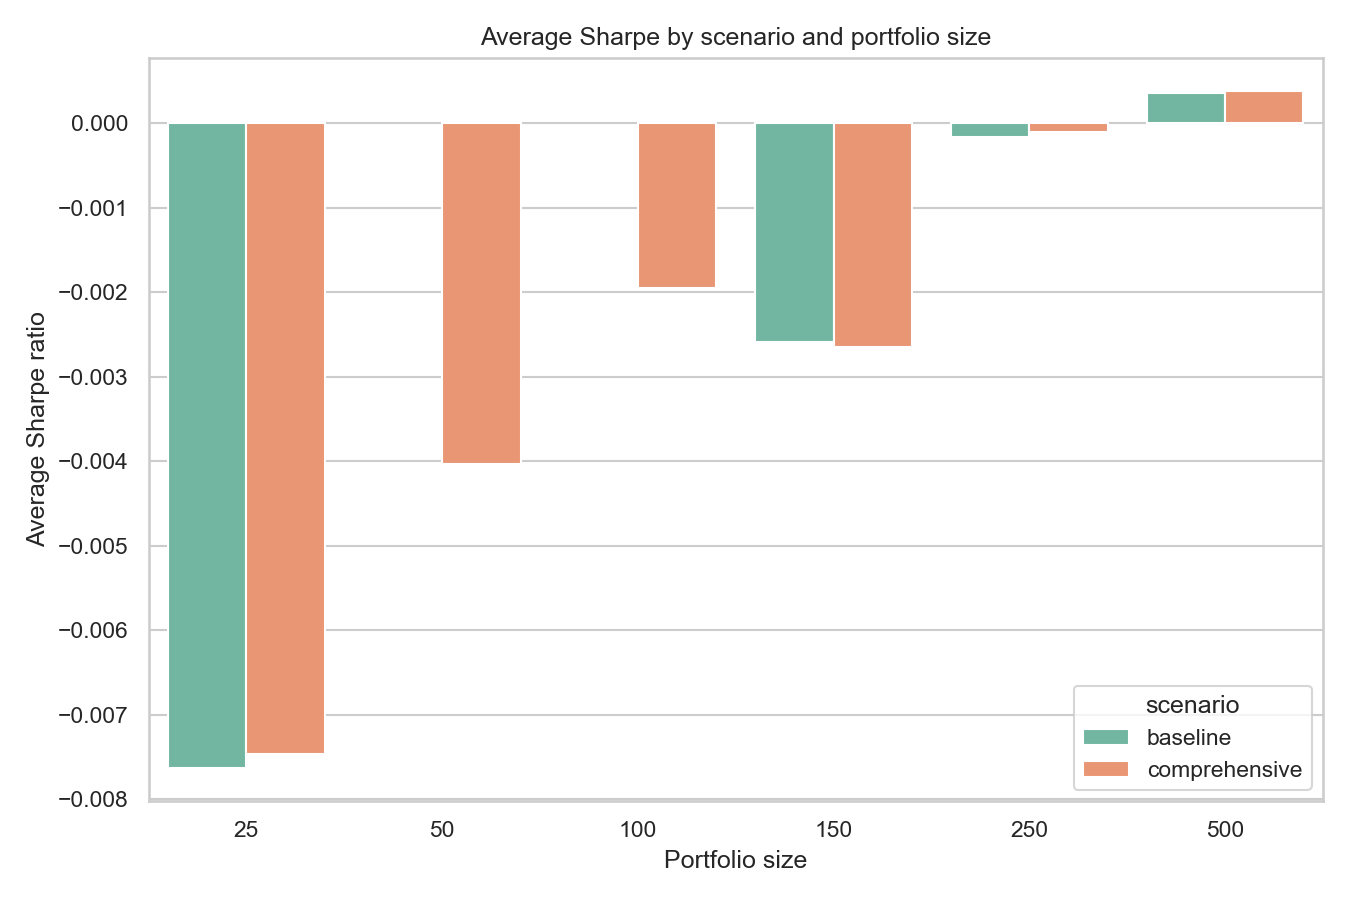
| portfolio_size | baseline_annual | comprehensive_annual | annual_delta | baseline_vol | comprehensive_vol | vol_delta | baseline_sharpe | comprehensive_sharpe | sharpe_delta |
|---|---|---|---|---|---|---|---|---|---|
| 25.0000 | -0.0241 | -0.0236 | 0.0005 | 0.2639 | 0.2640 | 0.0001 | -0.0076 | -0.0075 | 0.0002 |
| 50.0000 | NA | -0.0086 | NA | NA | 0.2462 | NA | NA | -0.0040 | NA |
| 100.0000 | NA | 0.0010 | NA | NA | 0.2360 | NA | NA | -0.0020 | NA |
| 150.0000 | -0.0008 | -0.0014 | -0.0006 | 0.2274 | 0.2280 | 0.0006 | -0.0026 | -0.0027 | -0.0001 |
| 250.0000 | 0.0025 | 0.0025 | 0.0000 | 0.2193 | 0.2194 | 0.0001 | -0.0002 | -0.0001 | 0.0000 |
| 500.0000 | 0.0058 | 0.0058 | -0.0000 | 0.2108 | 0.2113 | 0.0005 | 0.0004 | 0.0004 | 0.0000 |
Factor Attribution Snapshot
- Script:
scripts/factor_attribution.py(usesasset_value + cash,numpy.linalg.lstsq). - Value baseline sleeve: β_MKT ≈ 0.91, β_SMB ≈ 0.49, β_HML ≈ 0.42, α ≈ 0.00015, R² ≈ 0.52.
- Comprehensive shift ≈ 10 bps on beta; alphas stay inside ±20 bps.
- Full table:
logs/factor_attribution.csv(10 strategies × 2 scenarios).
Act II – Collaboration, Control, and Shared Guardrails
- Goal: keep policy authors, beneficiaries, and execution teams on the same rails.
- Focus: who controls mandates, who supplies conduct triggers, who implements and reports.
Collaboration Map
Institutions (boards/regents/trustees): set triggers, tracking-error caps, oversight cadence.
Individuals (beneficiaries/donors/clients): raise conduct pledges (Apartheid-Free leads inbound (Apartheid-Free Investment Coalition 2025)), log acceptable trade-offs.
Asset managers (internal/delegated): map mandates into optimiser constraints, enforce PIT hygiene, ship reproducible reporting.
Keep the loop tight: when all three roles stay in dialogue, the policy becomes recurring governance instead of a one-off gesture.
Selecting an Approach to Conduct Risk
Separating the Policy and the Process
- Policy = triggers; process = how to implement. Do not mix.
- Screening policy stores thresholds; Apartheid-Free pledge dominates recent inbound (Apartheid-Free Investment Coalition 2025); earlier cycles = weapons, factory farming, oil sands.
- Clients expect: which datasets, how evidence is vetted, how guidance propagates across the asset base.
- Once trigger set, optimisation playbook keeps tracking error ≤ 50 bps and documents trade-offs.
Implementation Framework for Fiduciaries
Divestment playbook = three repeats:
- Board mandate & guardrails: document triggers, cap tracking error at 30–50 bps, enforce sector/factor neutrality.
- Professional execution: freeze new buys, exit legacy positions over 30–60 days, redeploy proceeds via optimiser picks.
- Transparent monitoring: quarterly dashboards (tracking error, factors, attribution); exceptions trigger policy review, not PR.
Act III – Dryvest: Enabling Better Disagreement
- Built to land debates at node H in the flowchart—shared evidence, shared guardrails (Ethicic Research Team 2025).
- Mission: keep every constituency working off the same data artifacts, optimiser settings, reporting loop.
Why the Backtest Suite Exists
- Core belief: ethics = quality control; markets need opposing views to clear.
- Personal heuristics documented in CFA Institute’s Investment Idea Generation Guide (co-authored with Jason A. Voss) (Ortel and Voss 2016).
- Suite = shared lab: expanding to CTA overlays, commodity/FX, other “odd” modules so expectations stay explicit.
- Aim: map trade-offs so people disagree better, not to rack up wins.
- People move capital for noisy reasons: index churn, tax swaps, window dressing, event-driven flows, macro overlays, moral filters, activist pressure, earnings “beats” (rarely accurate), newsletter tips, gut feelings.
Working Queue
Note
- Finalise $500 MM min-cap reruns (baseline + comprehensive) and refresh tables once jobs finish.
- Regenerate missing 50/100-name baseline stats when jobs finish.
- Prototype Observable animated scatter if decks need motion.
- Sync PIT outputs into MotherDuck with timestamps for audit trail.
- Sample 10 strategies for factor-neutral re-optimisations to narrate alongside charts.
- Keep the content split: media feed separate, “Research” stays quantitative/process.
Publication Risk Checklist
- Add a preamble/disclaimer framing the piece as research, not investment advice.
- Confirm alignment with any firm-wide position on divestment before publishing under an institutional banner.
- Route final draft through legal/compliance review if an RIA or supervised entity will host it.
- Ensure code/data disclosures match the transparency standard we demand of others.
| Area | Specific Risk | Regulatory Source |
|---|---|---|
| Fiduciary Duty | Statements implying predictable performance could conflict with duty of care/loyalty | SEC IA Release No. 5248 |
| ESG/Exclusion Claims | ESG messaging must match internal process documentation | SEC v. BNY Mellon ESG Action |
| Communications Rule | Marketing-style language must meet FINRA Rule 2210 communication standards | FINRA Rule 2210 |
| Reputational Harm | Israel/Palestine framing may trigger backlash even with accurate math | Risk management (non-regulatory) |
| Methodology Integrity | Critiquing other studies demands full disclosure of our own assumptions | Research best practice |
- Outstanding critique checklist:
- Define statistical confidence intervals/p-values for PIT deltas.
- Extend factor attribution: time-varying betas, dispersion, interaction effects, unexplained variance.
- Model transaction costs: market impact, spreads, opportunity cost, tax, securities lending.
- Add literature engagement (Merton 1987; Heinkel, Kraus & Zechner 2001; Hong & Kacperczyk 2009; Pedersen et al. 2021; plus ESG premium studies).
- Cover liquidity/capacity impacts for small/mid-cap exclusions.
- Expand sample period to include COVID, 2022 energy, tech concentration regimes; document why predictive out-of-sample tests are out-of-scope for a descriptive PIT study.
- Incorporate risk dimensions: tail risk, tracking-error decomposition, drawdown behaviour, regime correlations, FX shifts.
- Flesh out methodology: Monte Carlo, parameter sensitivity, rebalancing frequency optimization, multi-worker reliability.
- Reposition Dryvest section to emphasise analytics infrastructure, not marketing copy.
- Proofread for typos, tighten argument narrative, add disclaimers.
References
Apartheid-Free Investment Coalition. 2025. “Apartheid-Free Pledge.” https://apartheidfree.org/pledge.
Ethicic Research Team. 2025. “Dryvest Divestment Brief Builder.” https://dryvest.ethicic.com.
JLens Investor Network, and Anti-Defamation League. 2024. “The Financial Cost of BDS.” https://www.adl.org/resources/report/financial-cost-bds.
Ortel, Sloane, and Jason A. Voss. 2016. “Investment Idea Generation Guide.” CFA Institute Research Foundation. https://www.goodreads.com/book/show/29246709-investment-idea-generation-guide.
Suggested Titles
- Point-in-Time Divestment Backtesting inside an Operating Portfolio
- Point-in-Time Exclusion Testing for an Institutional Fiduciary Mandate
- Point-in-Time Evidence on Divestment Tracking Error
- Testing Conduct Exclusions inside a Live Asset Management Process
- From Screening to Portfolio: Point-in-Time Testing of Exclusion Criteria
- What Divestment Costs in a Point-in-Time Institutional Backtest